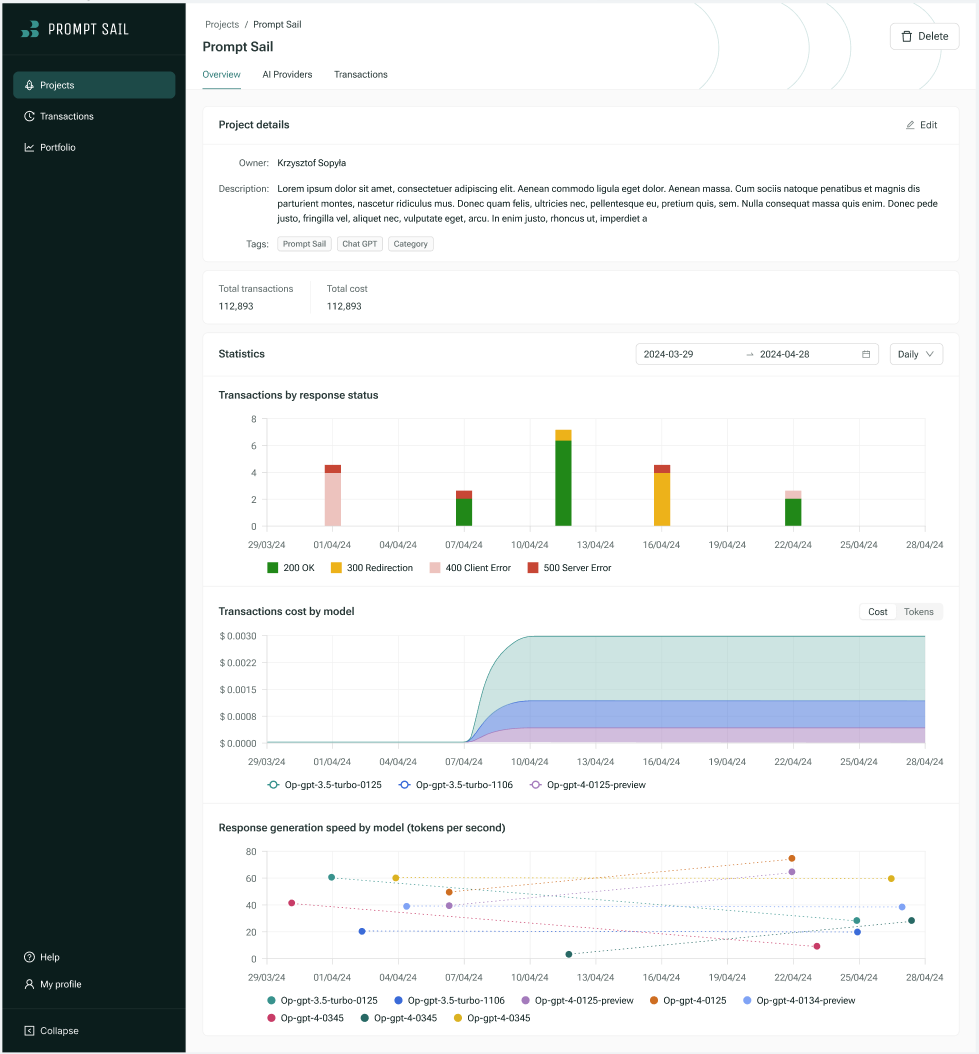
Project Dashboard
Overview
The Project Dashboard page provides users with comprehensive project information and convenient access to project-related actions such as editing, deleting, and managing transactions. It offers a comprehensive view of project details, ai providers and transaction statistics, enabling users to see models usage, track costs, and analyze interactions with Gen AI APIs.

Project Details
Information Pane
Within the project directory:
- Owner: Specifies the project owner.
- Description: Contains a brief description of the project. This section is editable.
- Tags: Tagging mechanism to categorize and easily search through projects.
Key Metrics
- Total Transactions: Displays the cumulative number of transactions made.
- Total Cost: Shows the total cost incurred.
Statistics and Chart Section
Transactions by Response Status
This bar chart provides a visual representation of transactions categorized by status codes:
- 200 OK (Green)
- 300 Redirection (Yellow)
- 400 Client Error (Light Red)
- 500 Server Error (Red)